Execution Detail
The execution detail page shows the full record of one handler invocation or job run: status, timing, trigger info, traceback, and the logs it emitted. Click any row in a handler's invocations table to open it.
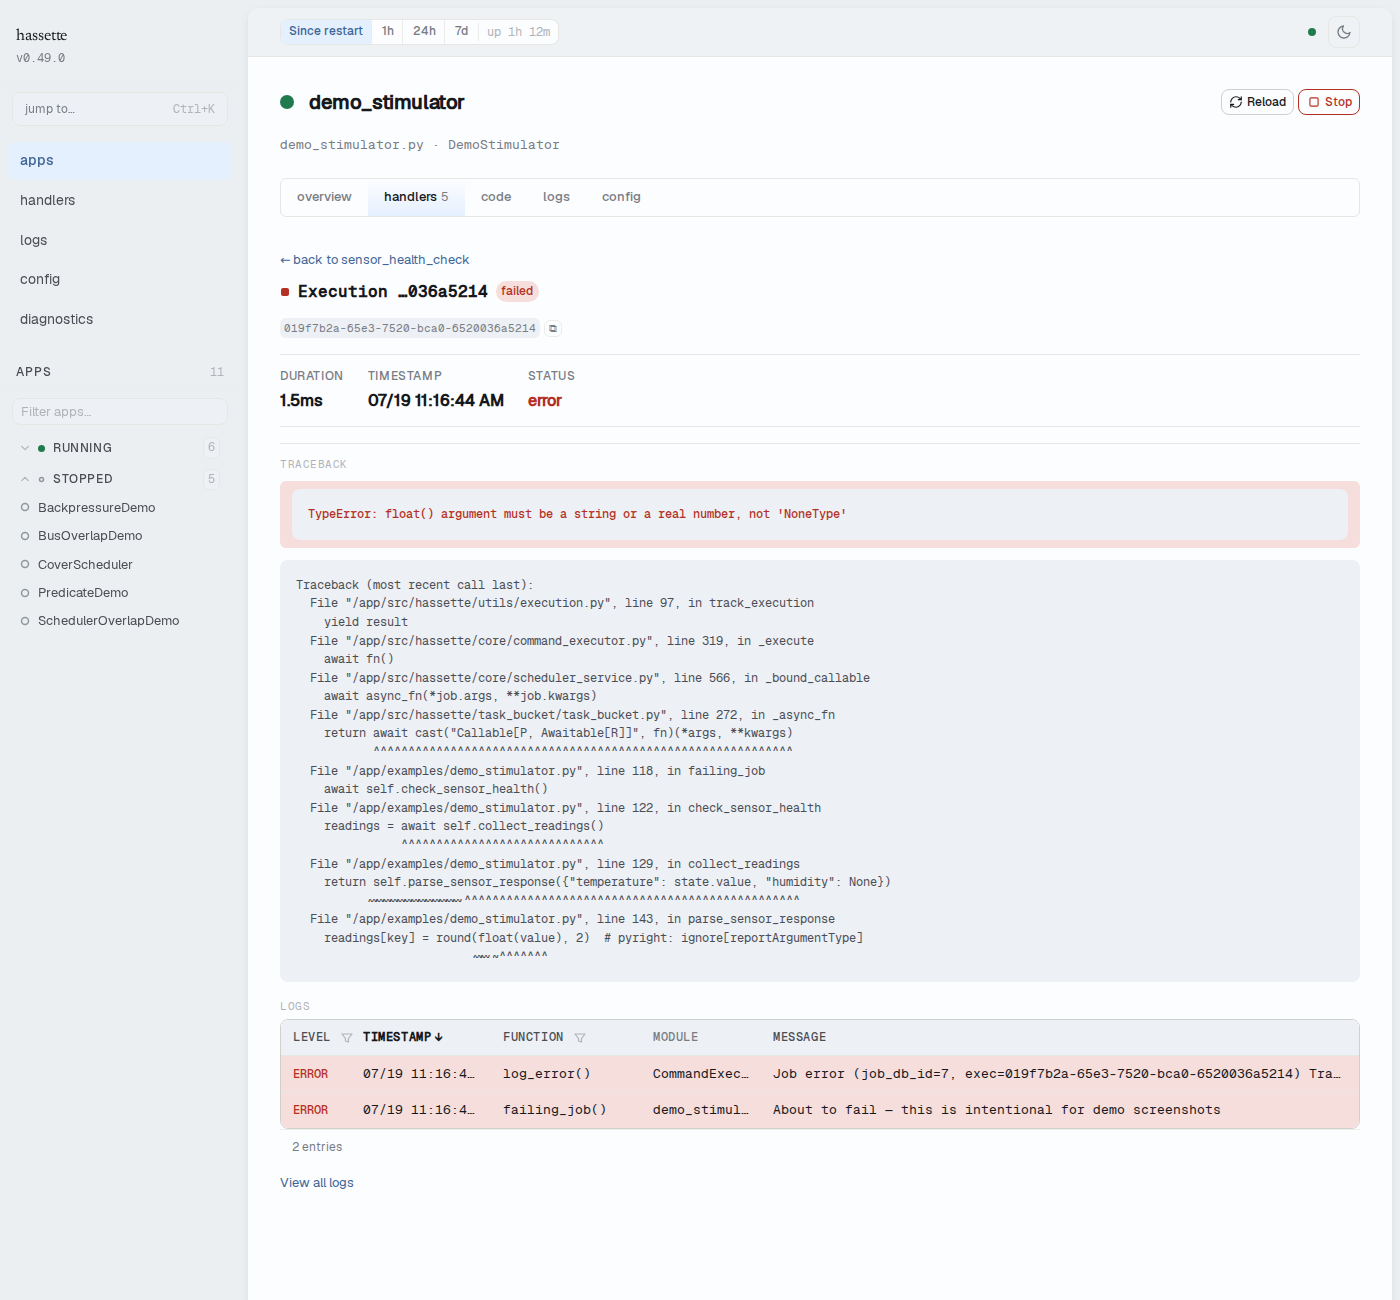
Header
A status shape and a truncated execution ID open the page. Status badges appear next to the ID for non-success outcomes: failed, timed out, cancelled, and thread leaked (the handler kept running past its timeout).
Below the header, the full execution ID appears in a monospace block with a copy button.
Meta Stats
A stats row shows duration, timestamp, and status for the run.
Trigger
A trigger section appears for executions that carry trigger data. It shows the trigger mode (currently only manual, for jobs triggered via the run-now button — absent for regular scheduled fires and handler invocations), a truncated context ID linking related executions, and the origin, when known.
Error or Outcome
Failed executions show the full Python traceback in a dedicated viewer. Timed-out and cancelled executions show duration and error details without a traceback — the framework skips traceback capture for these outcomes. Successful executions show a single line: a green status shape and the elapsed duration.
Logs
An inline log table lists every entry the execution emitted, filtered to its execution ID. A View all logs link opens the Logs page with the same filter applied, for cross-referencing against other executions or framework activity nearby.
Navigation
A back link at the top returns to the handler or job's detail panel.
The URL follows /apps/{appKey}/handlers/{kind}/{id}/exec/{executionId}, where kind is listener or job. The URL can be shared or bookmarked directly.
Related pages
- Debug a Failing Handler: the invocations table that links to this page
- Logs: the full log view behind "View all logs"
- Web UI overview: navigation, layout, and status bar controls