Handlers Tab
Use the Handlers tab to troubleshoot a single app. It presents every event handler and scheduled job in a master-detail layout: the left panel lists all handlers and jobs, and the right panel shows full detail for whichever item is selected.
Use it to read invocation history, inspect modifier configuration, locate the registration source, and trace a failure from the error type through the full traceback to the line in the source file.
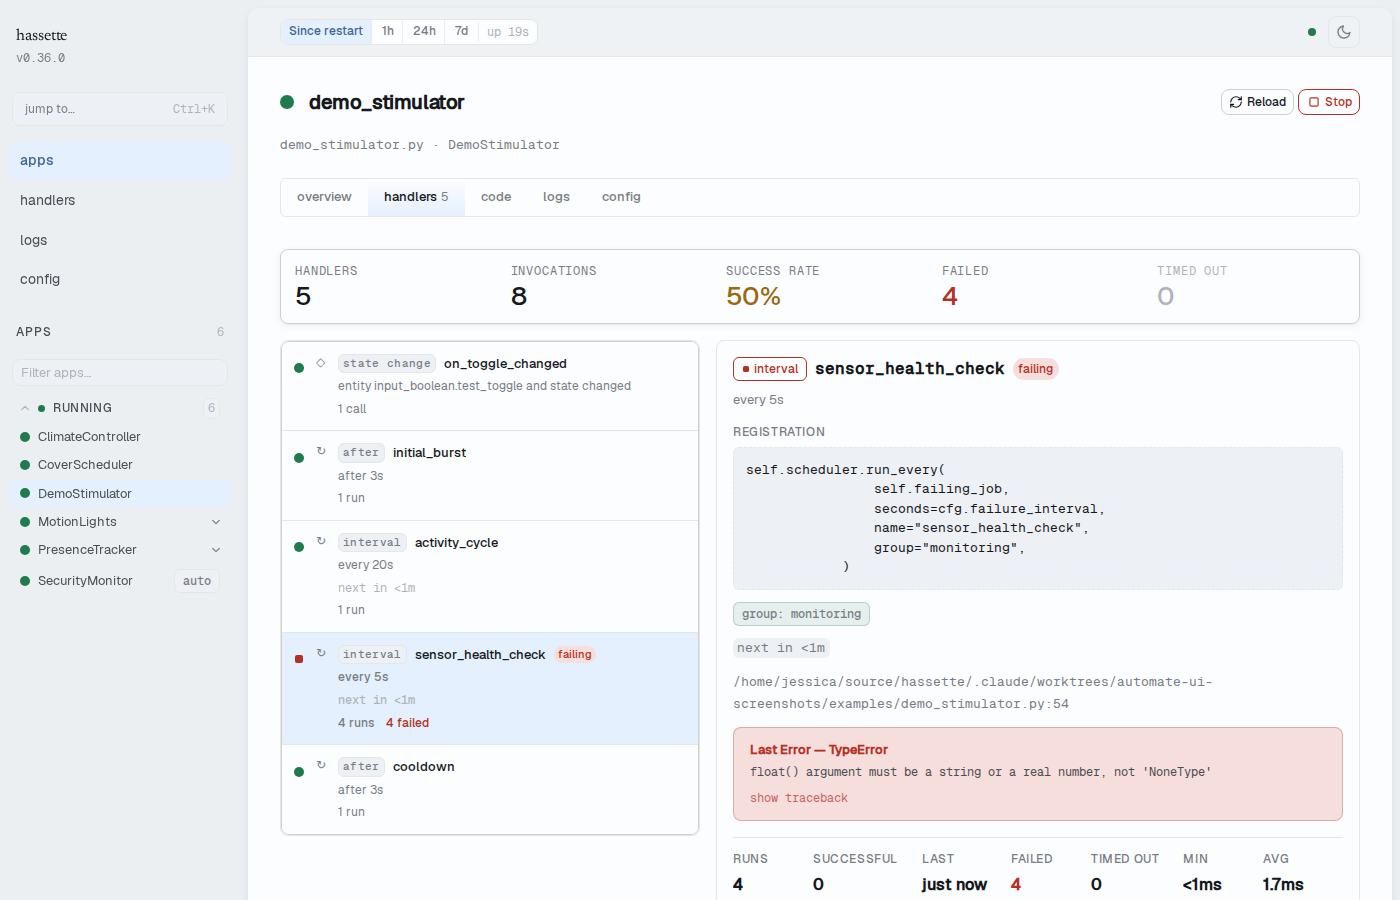
Stats strip
A stats strip above the master-detail layout shows aggregate metrics for this app's handlers and jobs. The numbers are scoped to the time-preset selector in the status bar.
| Stat | Description |
|---|---|
| Handlers | Total number of registered handlers and scheduled jobs |
| Invocations | Total calls and executions across all handlers and jobs in the time window |
| Success Rate | Percentage of invocations that completed without error |
| Failed | Number of invocations that raised an unhandled exception (highlighted in red when non-zero) |
| Timed out | Number of invocations that exceeded their timeout (highlighted in amber when non-zero) |
Handler list
The left panel lists every event handler and scheduled job registered by this app. Handlers appear before jobs. Failing items are shown with a red "failing" badge and their failed count in red.
Each row shows:
- Status dot — green if the handler has executed successfully and has no failures, red if it has any failures or timeouts, gray if it has never been invoked
- Type chip — the handler or trigger type (e.g.,
state change,interval,cron,daily,after,service call) - Handler or job name
- Trigger description — a human-readable description when available (e.g., the entity pattern, cron expression, or interval duration)
- Call or run count — total invocations (handlers) or executions (jobs)
- failed / timed out counts — shown in red or amber when non-zero
- Next run — for scheduled jobs, the relative time until the next scheduled execution
Click any row to select it and load the detail panel on the right.
On narrow viewports, the list and detail panels stack vertically. When a handler is selected on mobile, a "← back" button appears to return to the list.
Handler detail
When you select an event handler (state change, service call, or other event type), the right panel shows the handler detail view.
Header
- Kind chip — the handler type label with a status dot (e.g.,
state change,service call) - Handler name — the Python method name
- "failing" badge — shown in red when the handler has failures or timeouts
Registration source
The registration source shows the exact Python call that registered this handler, as recorded at startup — for example:
await self.bus.on_state_change("light.kitchen", handler=self.on_light_change, name="kitchen_light")
Modifier chips
Modifier chips appear when the handler was registered with any of the following options:
| Chip | Meaning |
|---|---|
debounce <ms> |
Handler invocation is debounced by the specified duration |
throttle <ms> |
Handler invocations are throttled to at most one per duration |
once |
Handler fires only on the first matching event, then deregisters |
priority <n> |
Handler runs with the specified dispatch priority |
immediate |
Handler fires immediately on the initial state, not just on changes |
duration <s> |
Handler requires the trigger condition to hold for the specified duration |
Chips are only shown for options that are configured. A handler with no modifiers shows no chip row.
Source location
The source location shows the file path and line number where this handler is defined
(e.g., apps/climate_controller.py:42). Click view in code → to navigate to the
Code tab with the file scrolled to that line.
Error banner
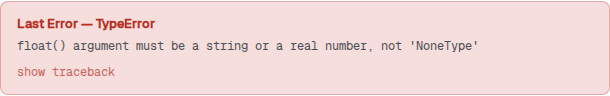
When a handler is failing, a red error banner appears below the source location:
- Error type — the Python exception class (e.g.,
TypeError) - Error message — the full exception message
- show traceback — expands the full Python traceback inline
The error banner is only shown when the handler has at least one failure. It disappears if the handler subsequently runs successfully.
Stats grid
The stats grid shows aggregated metrics for this handler:
| Stat | Description |
|---|---|
| Calls | Total invocations in the time window |
| Successful | Invocations that completed without error |
| Last | Relative time of the most recent invocation |
| Failed | Invocations that raised an unhandled exception (red when non-zero) |
| Timed out | Invocations that exceeded their timeout (amber when non-zero) |
| Cancelled | Invocations that were cancelled (shown only when non-zero) |
| Min | Fastest recorded execution time |
| Avg | Mean execution time across all invocations |
| Max | Slowest recorded execution time |
Invocations table
Below the stats grid, the invocations panel lists the most recent handler invocations:
| Column | Description |
|---|---|
| Status | Green dot for success, or the error type label (e.g., TypeError) in red for failure |
| Timestamp | When the invocation occurred |
| Duration | How long the invocation took |
| Execution ID | The unique identifier for this invocation, useful for correlating with log entries |
Up to 50 of the most recent invocations are shown. The table updates in real time.
Job detail
When you select a scheduled job (interval, cron, daily, or after trigger), the right panel shows the job detail view. The layout mirrors the handler detail view, with the following differences.
Header
- Kind chip — the trigger type label (e.g.,
interval,cron,daily,after) - Job name — the name assigned when the job was scheduled. An info icon (ⓘ) next to the
name indicates it was auto-generated; pass
name="..."when scheduling for a descriptive label.
Registration source
Same as the handler detail — shows the Python call that scheduled this job (e.g.,
self.scheduler.run_every(self.check_temperature, Every(minutes=5))).
Schedule chips
Schedule chips appear when the job was configured with:
| Chip | Meaning |
|---|---|
±<n>s jitter |
Each execution fires at a random offset within ±n seconds of the scheduled time |
group: <name> |
The job belongs to a named group (used for bulk cancellation) |
Trigger detail
Below the schedule chips, the job's trigger description and next scheduled run time are shown:
- Trigger label — a human-readable description of the trigger (e.g., "every 5 minutes", "daily at 07:00", "run once in 30s")
- Trigger detail — the formatted trigger specification (e.g.,
07:00 America/New_York) - Next run — relative time until the next scheduled execution (e.g., "next in 3 min"),
or
fire at <time>for one-shot jobs
Error banner
Same as the handler error banner — shown only when the job has at least one failure.
Stats grid
The job stats grid uses the same layout as the handler stats grid, with Runs in place of Calls.
Executions table
The executions panel lists the most recent job executions with the same columns as the handler invocations table. Up to 50 of the most recent executions are shown.
Empty state
If an app has no event handlers or scheduled jobs registered, the Handlers tab shows:
"no handlers or scheduled jobs registered." This can occur for apps that are still
initializing or that delegate all work to external triggers without registering handlers
in on_initialize.
Related pages
- Overview Tab — handler health at a glance; the "failing handlers" section links directly to individual handlers in this tab
- Code Tab — "view in code →" from handler detail navigates here at the handler's source line
- Logs Tab — check per-app log entries; use the execution ID from the invocations table to filter logs to a specific invocation
- App Detail — shared elements: breadcrumb, header, instance switcher, and tab strip overview