Handlers
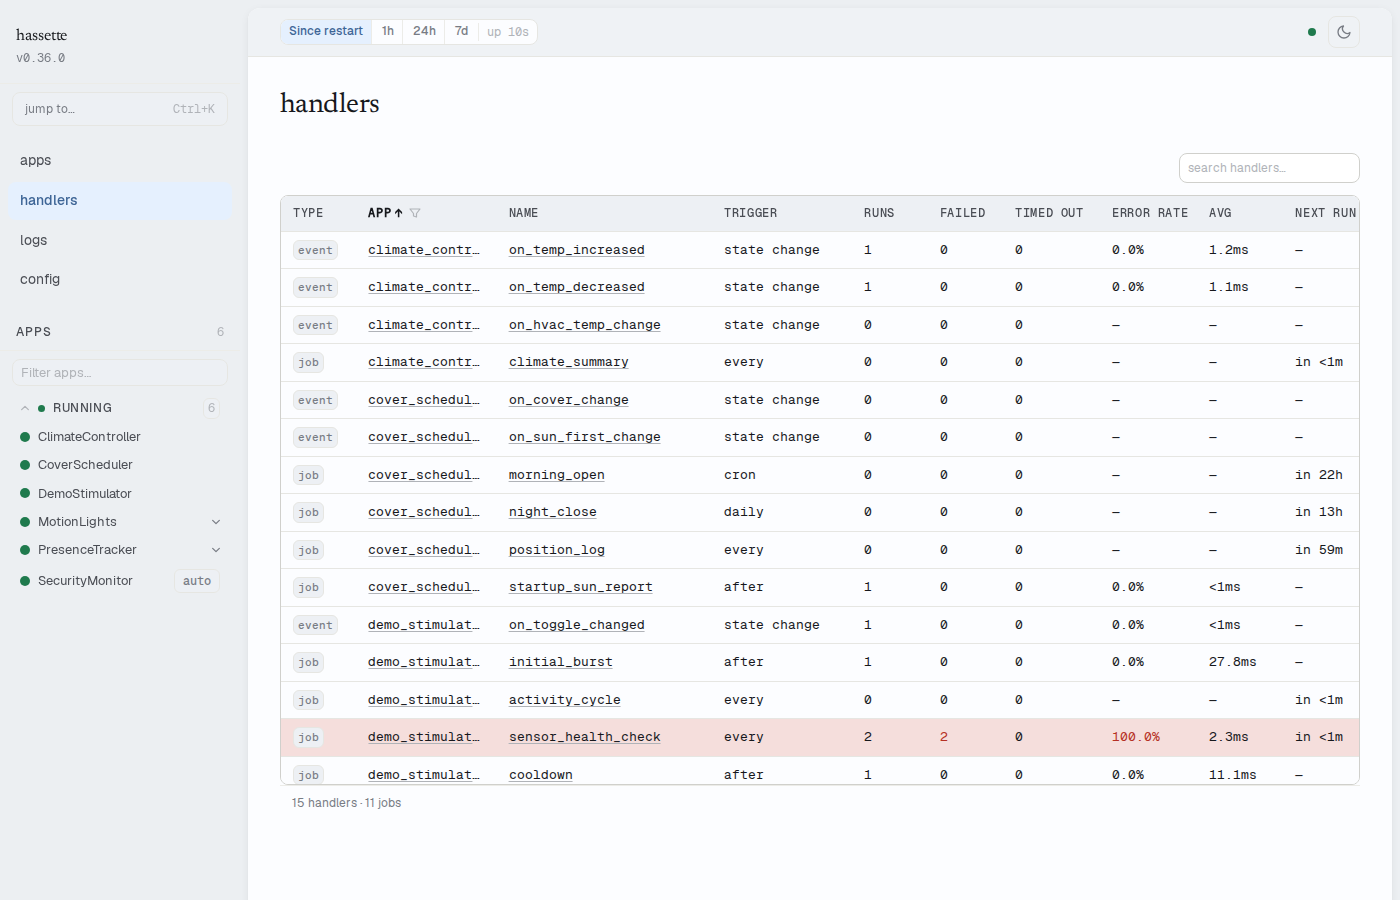
The Handlers page shows every registered handler and scheduled job across all your apps in a single table. Navigate here when you need to find all handlers listening to a specific entity, scan error rates across your entire automation fleet, or identify which app owns a particular handler without clicking into each app individually.
Handler table
The table combines event handlers (listeners) and scheduled jobs into one unified view. Each row represents one handler or job.
| Column | Sortable | Filterable | Description |
|---|---|---|---|
| Type | Yes | No | chip showing event for state/attribute/service handlers, or job for scheduled jobs |
| App | Yes | Yes (dropdown) | App key that owns the handler |
| Name | Yes | No | Handler function name; click to go to the handler detail in the app's Handlers tab |
| Trigger | Yes | No | Listener kind (e.g. state_change) or job trigger description (e.g. every 30s) |
| Runs | Yes | No | Total invocations or executions within the current time window |
| Failed | Yes | No | Number of failed invocations; shown in red when non-zero, — otherwise |
| Timed out | Yes | No | Number of timed-out invocations; shown in amber when non-zero, — otherwise |
| Error rate | Yes | No | Failed ÷ runs, expressed as a percentage; shown in red when non-zero |
| Avg | Yes | No | Average handler duration |
| Next run | Yes | No | For scheduled jobs: time until the next scheduled execution; — for event handlers |
All count columns (Runs, Failed, Timed out, Error rate, Avg) reflect the time window set by the time-preset selector in the status bar.
Rows with at least one failure are highlighted in red to make problem handlers easy to spot at a glance.
Search
The search box filters by handler name, app key, and trigger description. Results update as you type.
App filter
Use the App column filter dropdown to restrict the table to handlers from a single app. The dropdown lists all app keys with registered handlers.
Footer
The table footer shows a combined count: "N handlers · M jobs", reflecting the number of rows currently visible after search and filter.
Mobile layout
On narrow viewports, the table switches to a card layout. Each card shows the handler name, app key, type chip, trigger, run counts, error counts, average duration, and next run time. Cards with failures are highlighted in red, matching the desktop table behavior.
Related pages
- App Detail — Handlers Tab — per-app drill-down with a full detail panel: invocation history, error messages, source location, and a link to view the handler in the code viewer
- Logs — filter by execution ID to trace a handler's log output for a specific invocation
- Apps — return to the app list for app-level monitoring