Layout & Navigation
Every page in the Hassette web UI shares the same chrome: a sidebar for navigation, a status bar at the top, and a command palette for keyboard-driven navigation.
Sidebar
The sidebar handles navigation. It stays visible on all pages and updates in real time as app statuses change.
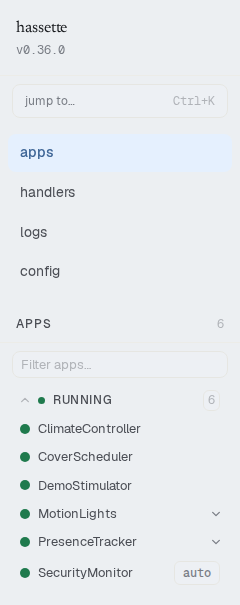
Wordmark and version
The hassette wordmark at the top of the sidebar is a link to the Apps page. The running hassette version (v0.x.y) appears below it.
Command palette trigger
Below the wordmark, a "jump to…" button opens the command palette. The keyboard shortcut is shown alongside it — Ctrl+K on Windows/Linux, ⌘K on macOS.
Navigation items
Four top-level items link to the main pages:
| Item | Page |
|---|---|
| apps | Apps — all automations |
| handlers | Handlers — cross-app handler table |
| logs | Logs — global log viewer |
| config | Config — system configuration |
Apps section
Below the top-level nav, the Apps section lists all loaded automations grouped by lifecycle status. A count badge shows the total, and a search input filters by display name or app key as you type.
Status groups — Apps are grouped by status: FAILING, BLOCKED, SLOW, RUNNING, STOPPED, and DISABLED. Each group is collapsible with a count. When all apps are healthy, the RUNNING group is expanded by default.
Multi-instance apps — Apps with more than one instance show a chevron to expand individual instance sub-items.
"auto" chip — Apps detected automatically from the app directory (not explicitly configured in hassette.toml) show a small auto chip.
Status bar
The status bar runs across the top of every page with time-scoping controls, system uptime, connection status, and the theme toggle.

Time-preset selector
Four buttons control the time window used for all telemetry counts and tables across the UI:
| Preset | What it shows |
|---|---|
| Since restart | All data since the most recent Hassette startup |
| 1h | Data from the past 1 hour |
| 24h | Data from the past 24 hours |
| 7d | Data from the past 7 days |
Since restart shows data from the last Hassette startup to now, regardless of how long the process has been running. The other presets use wall-clock windows. Hassette persists your last-used preset across page reloads.
Status indicators
The status bar can show inline indicators when the system is degraded:
- "N dropped" — telemetry events dropped due to buffer overflow, write failures, or shutdown
- "N handler errors" — user-supplied error handlers are themselves raising exceptions
These are distinct from the amber "Telemetry degraded" alert banner, which covers database backpressure at the page level.
WebSocket connection indicator
A dot on the right side of the status bar shows the WebSocket connection status — green when connected, with a text label ("Reconnecting..." or "Disconnected") when the connection drops.
Command palette
The command palette lets you jump to any page, app, handler, or action without using the mouse. Press Ctrl+K (Windows/Linux) or ⌘K (macOS) to open it.
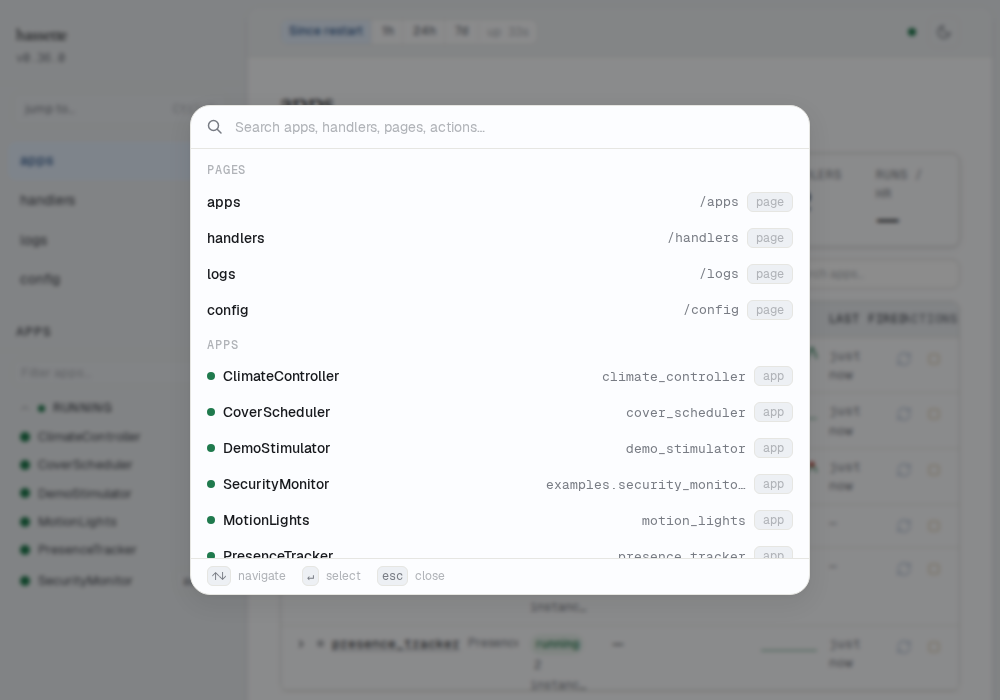
The palette organizes results into sections:
| Section | Contents |
|---|---|
| pages | The four top-level pages (apps, handlers, logs, config) |
| apps | All loaded apps, each with a status dot and app key |
| instances | Individual instances of multi-instance apps |
| handlers | All registered handlers across all apps |
| actions | Bulk operations: Reload all apps, Stop all failing, Open docs |
Typing in the search box filters all sections simultaneously. On narrow viewports, the sidebar is replaced by a hamburger menu that opens a slide-in drawer with the same navigation.
Alert banners
Failed apps — When one or more apps are in a failed state, a red alert banner lists the app names and their most recent error message. Clicking an app name navigates to its detail page.
Telemetry degraded — When the telemetry database is under backpressure, an amber warning banner appears. Some historical data may be missing while the banner is visible.
Related pages
- Web UI Overview — enabling, accessing, and configuring the web UI
- Apps — monitor and manage your automations from the main app table