Apps
The Apps page is the landing page of the hassette web UI (/ redirects to /apps). It gives
you a single view of every registered automation — their health status, recent activity, and
last error — so you can confirm everything is running at a glance or spot a problem before it
affects your home.
Use it for routine monitoring ("are all my automations healthy?") and as the entry point for troubleshooting ("which app is failing, and how do I drill in?").
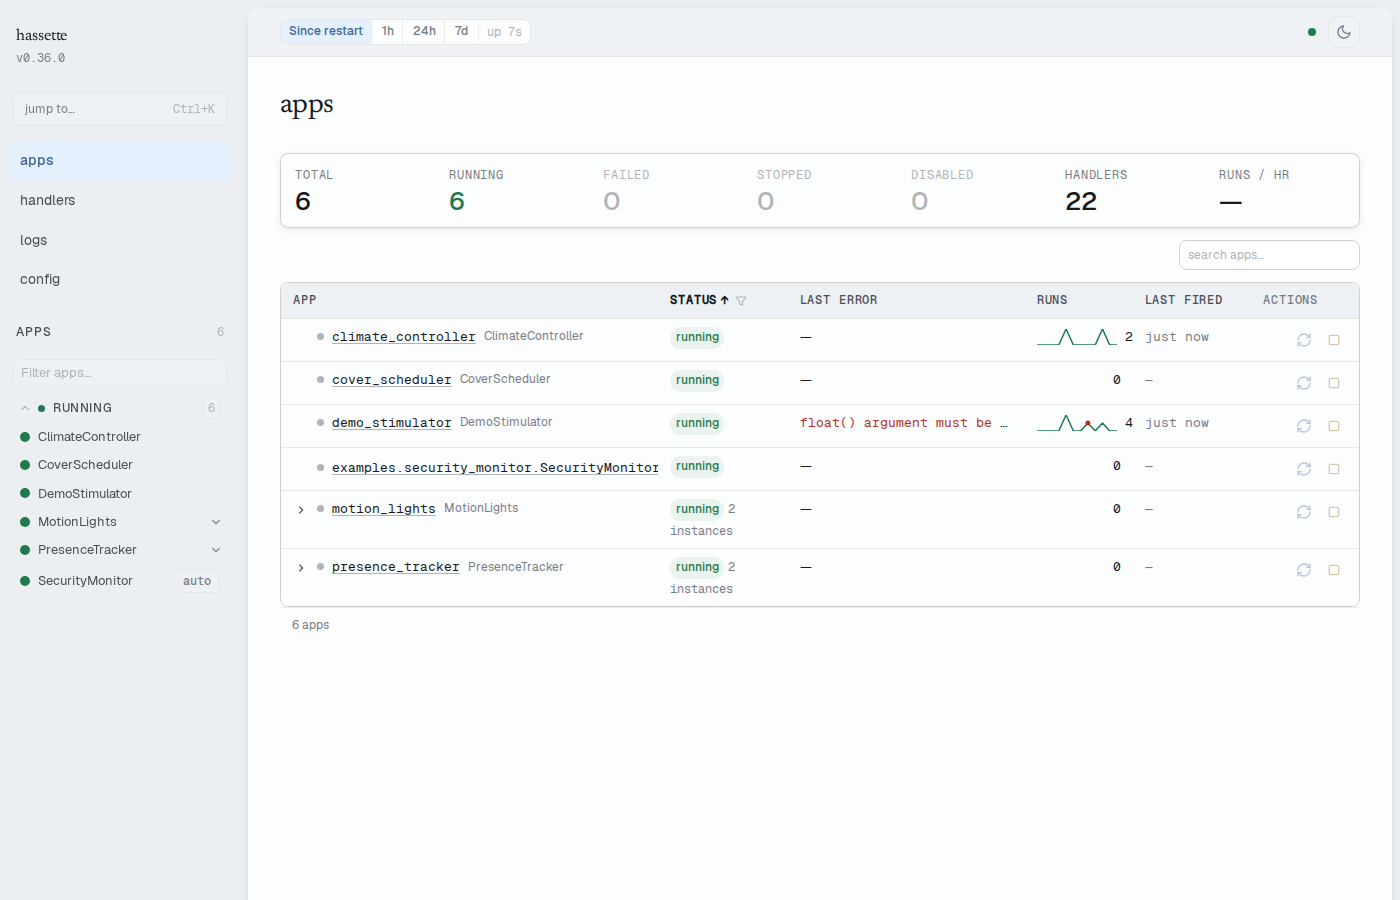
Stats strip
The stats strip at the top of the page shows aggregate counts across all your apps. The numbers are scoped to the time window selected in the time-preset selector in the status bar.
| Stat | Description |
|---|---|
| TOTAL | Total number of registered apps |
| RUNNING | Apps currently in the running state |
| FAILED | Apps that have crashed or thrown an unhandled error |
| STOPPED | Apps that were manually stopped |
| DISABLED | Apps disabled via configuration |
| HANDLERS | Total handler and scheduled job count across all apps |
| RUNS / HR | Handler and job invocations per hour in the current time window |
Tip
A non-zero FAILED count turns the cell red. Use it as a quick health indicator — if the failed count is zero, all your automations are alive.
App table
The table shows one row per app. Columns:
| Column | Description |
|---|---|
| APP | Status dot, app key (links to App Detail), class name, and "auto" chip if auto-detected. Multi-instance apps show a collapse/expand chevron. |
| STATUS | Lifecycle state badge. Multi-instance parent rows also show the instance count (e.g., "2 instances"). Click the column header to sort; click the filter icon to open a popover and filter by status (running, failed, stopped, disabled, blocked). |
| LAST ERROR | Most recent error message, truncated to the cell width. Click the cell to expand the full message. Shows — when the app is healthy. |
| RUNS | Activity sparkline showing invocation frequency over the time window, plus the total handler and job run count. |
| LAST FIRED | Relative timestamp of the most recent handler or job execution (e.g., "3 min ago"). Shows — if the app has never fired. |
| ACTIONS | Context-sensitive action buttons. See Actions below. |
Sorting
Click any sortable column header (APP, STATUS, LAST ERROR, RUNS, LAST FIRED) to sort by that column. Click again to reverse direction. The table defaults to sorting by STATUS so failing apps appear first.
Searching
The search box above the table ("search apps…") filters rows by app key and class name as you type. Searching and status filtering work together — you can search for "motion" while filtering to only failed apps.
Status filter
Click the filter icon on the STATUS column header to open a popover with per-status counts. Select a status to narrow the table to only apps in that state. The available options are:
- all — every registered app (default)
- running — apps currently executing
- failed — apps that have encountered an unhandled error
- stopped — apps manually stopped via the UI or API
- disabled — apps disabled in
hassette.toml - blocked — apps waiting for a dependency to become ready (resolves automatically at startup once the dependency is available)
Options with a count of zero are hidden from the popover.
Actions
Each app row shows context-sensitive action buttons based on the app's current status:
| Button | Available when | Effect |
|---|---|---|
| Start | stopped, failed, or disabled | Starts (or restarts) the app |
| Reload | running | Reloads the app, picking up code and config changes without a full restart |
| Stop | running | Stops the app; it will no longer process events until restarted |
Multi-instance apps
Apps configured with multiple instances show a collapse/expand chevron in the APP column. The parent row shows the aggregate instance count (e.g., "2 instances") next to the status badge in the STATUS column.
Click the chevron to expand the parent row into individual instance rows. Each instance row shows:
- The instance name (links to the App Detail page for that instance)
- Instance-level status dot and badge
- Instance-level last error message
- Instance-level action buttons
Collapse the row by clicking the chevron again.
"auto" chip
Apps discovered automatically from the apps directory (rather than explicitly listed in
hassette.toml) show an auto chip next to the class name in the APP column. If you
see the chip on an app you didn't expect, check your hassette.toml — the app is being
loaded by directory scan, not by an explicit entry.
Mobile layout
On narrow viewports the table switches to a card layout. Each card shows the same data as a table row. The STOPPED and DISABLED stats strip cells are combined into a single INACTIVE cell to fit the narrower screen.
Related pages
- Web UI Overview — enabling, accessing, and configuring the web UI
- App Detail — drill into a single app to see handler health, error detail, code, logs, and config
- Layout & Navigation — explains the time-preset selector that scopes the stats strip and RUNS sparklines