Overview Tab
The Overview tab is the default view when you open any app in App Detail. It shows the health of every handler and scheduled job at a glance, highlights active failures, and provides a rolling view of recent activity and log entries — so you can confirm an app is healthy or locate a problem without leaving a single page.
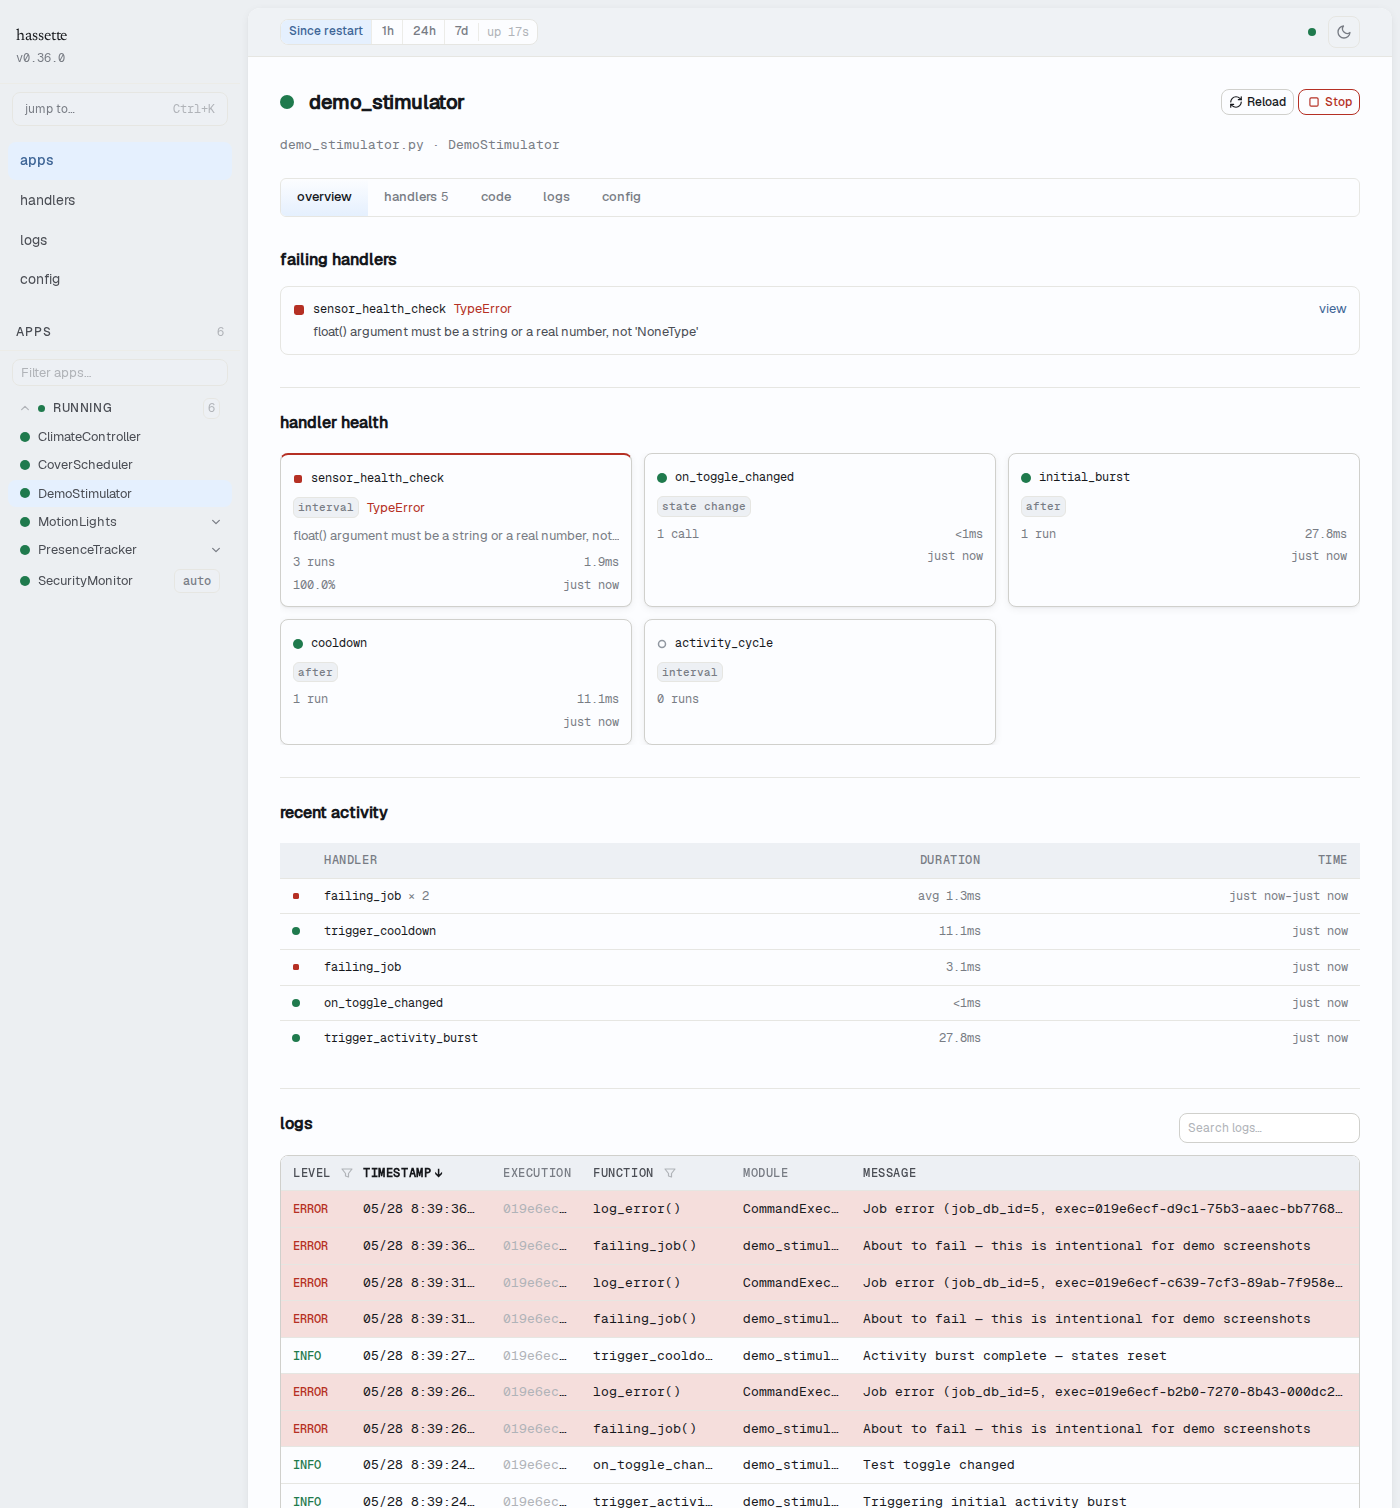
Error spotlight

The error spotlight section appears at the top of the Overview tab when one or more handlers are currently failing. It is hidden when all handlers are healthy — you will not see this section on a healthy app.
Each entry in the section shows:
- Status dot — red, indicating a failing state
- Handler name — the method name of the failing handler
- Error type — the Python exception class (e.g.,
TypeError,KeyError) - Error message — the exception message, truncated to the available width
- view link — navigates directly to the handler's detail panel in the Handlers tab
If more than three handlers are failing, the section shows the first three with a "show N more" button to expand the full list.
Tip
The "view" link is the fastest path from spotting a failure to reading the full error. Click it to jump to the Handlers tab with that handler already selected and its error banner visible.
Handler health
The handler health section shows a card for every handler and scheduled job registered by this app. Failing handlers sort to the front.
Each card shows:
- Status dot — green if the handler has executed successfully and has no failures, red if it has any failures or timeouts, gray if it has never been invoked
- Handler name — the method name (for event handlers) or job name (for scheduled jobs)
- Type chip — the handler or trigger type (e.g.,
state change,interval,cron,daily,after,service call) - Call / run count — total invocations (handlers) or executions (jobs) in the time window
- Avg duration — average execution time, shown when the handler has run at least once
- Error rate — percentage of failing runs, shown only when failures exist
- Last active — relative timestamp of the most recent invocation
Failing cards also show the error type and a truncated error message.
Click any card to navigate to that handler's detail panel in the Handlers tab.
Note
A fresh install with no automation activity shows gray status dots and zero counts across all cards. This is normal — cards populate as handlers fire.
Recent activity
The recent activity section shows a table of the most recent handler and job executions across all handlers for this app.
| Column | Description |
|---|---|
| (status dot) | Green for a successful execution, red for a failed one |
| Handler | Handler or job name. Consecutive executions of the same handler with the same status are grouped into a single row (e.g., on_state_change × 5). |
| Duration | Execution time. For grouped rows, shows the average duration across the group. |
| Time | Relative timestamp of the execution. For grouped rows, shows the time range (e.g., 2 min ago–1 min ago). |
Up to 20 of the most recent entries are shown. The table updates in real time as handlers fire.
Logs
The logs section at the bottom of the Overview tab shows recent log entries scoped to this app. It includes a search field — type in "Search logs…" to filter by message content. The table updates in real time.
For level filtering, column picker, detail drawer, and execution ID filtering, use the dedicated Logs tab.
Related pages
- Handlers Tab — drill into individual handler and job details, including full invocation history, modifier configuration, source location, and error tracebacks
- Logs Tab — per-app log entries with full filtering; the embedded logs section above is a subset of this tab
- App Detail — shared elements: breadcrumb, header, instance switcher, and tab strip overview